Data Analysis Portfolio - Ahmed Elatwy
Data Analyst | Turning Data into Revenue-Driving Insights
I help e-commerce & industrial businesses reduce churn, optimize pricing, and uncover hidden profit using data you already have.
👋 Why Work With Me?
I’m not just a data analyst. I’m a Geophysics graduate + R&D Chemist who learned to translate complex industrial data into business decisions. I understand the Egyptian market, speak your language, and deliver insights you can actually use.
🛠️ Technical Skills
| Category | Technologies |
|---|---|
| Programming | Python, SQL |
| Libraries | Pandas, NumPy, Matplotlib, Seaborn, Scikit-learn |
| Visualization | Power BI, Excel, Tableau, Plotly |
| Tools | Jupyter Notebook, Git, GitHub |
| Methodologies | Data Cleaning, EDA, Statistical Analysis, Retention Analysis, Machine Learning |
📊 Projects Portfolio
📈 Case Study: London Real Estate Investment Estimator
-
Client Type: Real Estate Investment Firms & Property Arbitrage Investors in London
-
Problem: Price ≠ Value: Traditional analysis misses location nuances and guest sentiment, causing investors to overpay for ‘overpriced junk’ or miss undervalued gems
- My Approach:
- Built end-to-end ML engine analyzing 96,000 listings with 150+ features
- applied NLP (VADER) on 50,000+ reviews for sentiment scoring, geospatial engineering (Haversine distance), and XGBoost regression to predict fair market value
- Result:
- Achieved R² of 0.82 (MAE $28)
- discovered ‘Bedrooms & Privacy’ drive price 3x more than sentiment
- properties within 5km of center command 40% premium
- successfully identified undervalued arbitrage opportunities
- Tools: Python, Pandas, NumPy, XGBoost, Scikit-Learn, NLTK (VADER), Folium, Haversine, Streamlit
| Live App | GitHub |

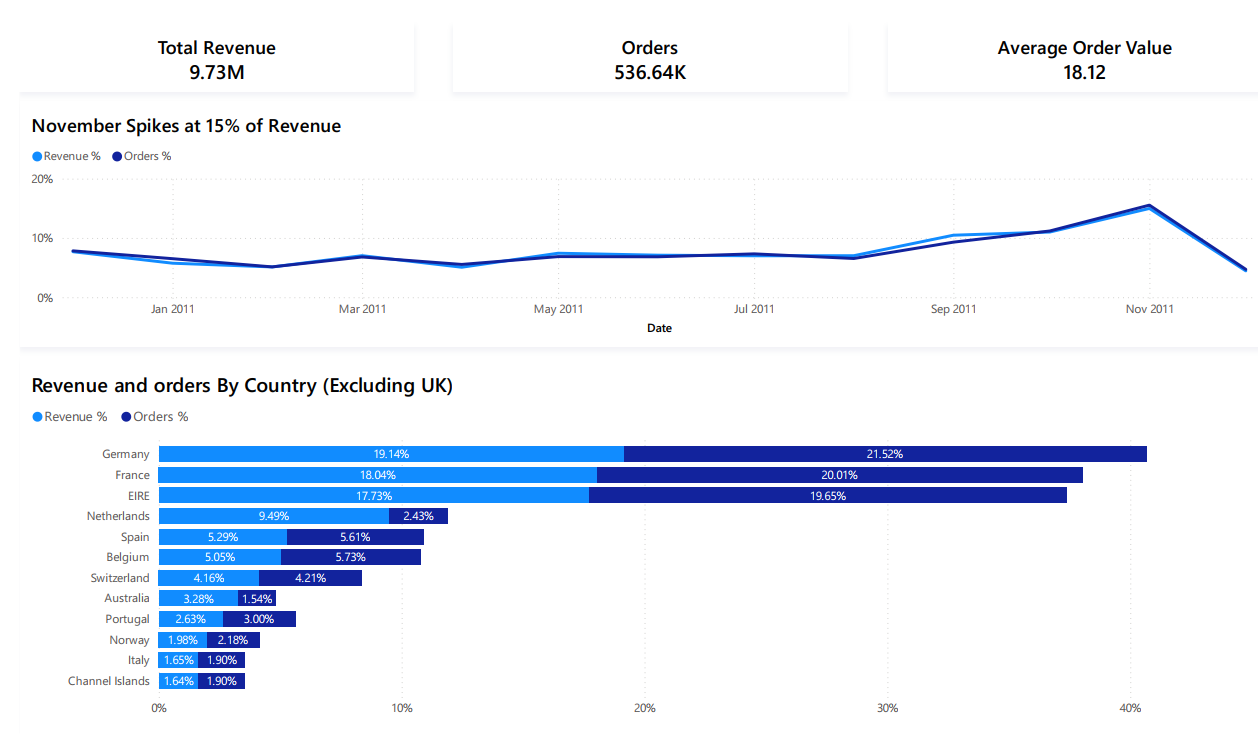
📈 Case Study: E-Commerce Data Analysis & Customer Segmentation
-
Client Type: Transnational E-Commerce Retailer (B2B/B2C) with 4,200+ customers across multiple countries
-
Problem: No unified view of customer value or behavior: marketing spend was inefficient, churn was unaddressed, and high-value segments were being overlooked
- My Approach:
- Analyzed 540K+ transactions using Python (Pandas, RFM + Cohort analysis)
- engineered a two-tier dataset strategy to separate financial reporting from behavioral analysis
- built interactive Power BI dashboard for executive decision-making
- Result:
- Identified ‘Champions’ segment (643 customers) driving ~80% of revenue
- discovered 80% of daily revenue concentrates on Thursdays 10AM–3PM
- revealed 3-month retention drop-off; delivered 4 actionable strategies including VIP program and targeted win-back campaigns
- Tools: Python, Pandas, NumPy, Matplotlib, Seaborn, Power BI, Tableau, Git/GitHub
| **Kaggle Notebook | GitHub | Executive Summary PDF** |
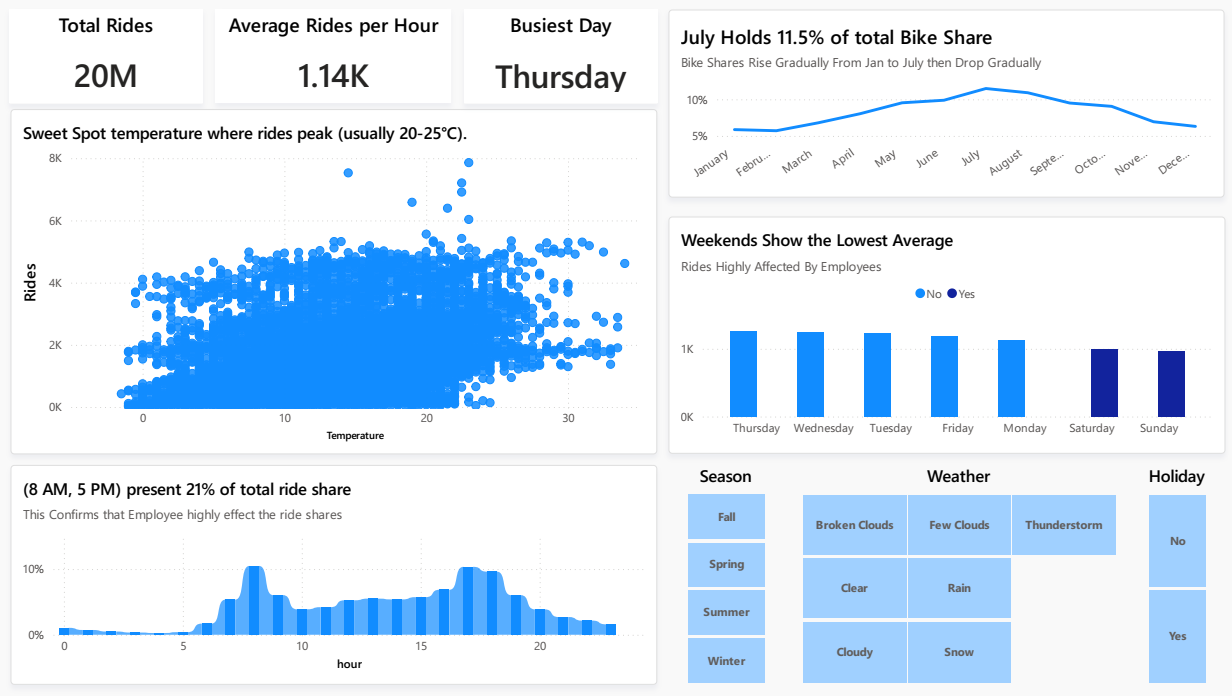
📈 Case Study: London Bike-Sharing Demand Forecasting
-
Client Type: “Urban Mobility Operator Managing London’s Public Bike-Sharing Fleet”
-
Problem: Unpredictable demand spikes and weather-driven fluctuations caused inefficient fleet redistribution, leading to empty stations during rush hour and idle bikes during off-peak times
- My Approach:
- Analyzed 2+ years of historical ride data (2015-2017) combined with weather APIs
- engineered temporal features (hourly/weekly patterns) and trained a Random Forest Regressor to forecast demand at station-level granularity
- Result:
- Achieved R² of 0.95 in demand prediction
- identified commuter-driven peaks at 8AM/5PM, temperature as the #1 demand driver, and 39% rain-induced drop with 61% user retention
- enabled data-backed staffing and maintenance scheduling
- Tools: Python, Pandas, Scikit-Learn (Random Forest), Matplotlib, Seaborn, Weather APIs
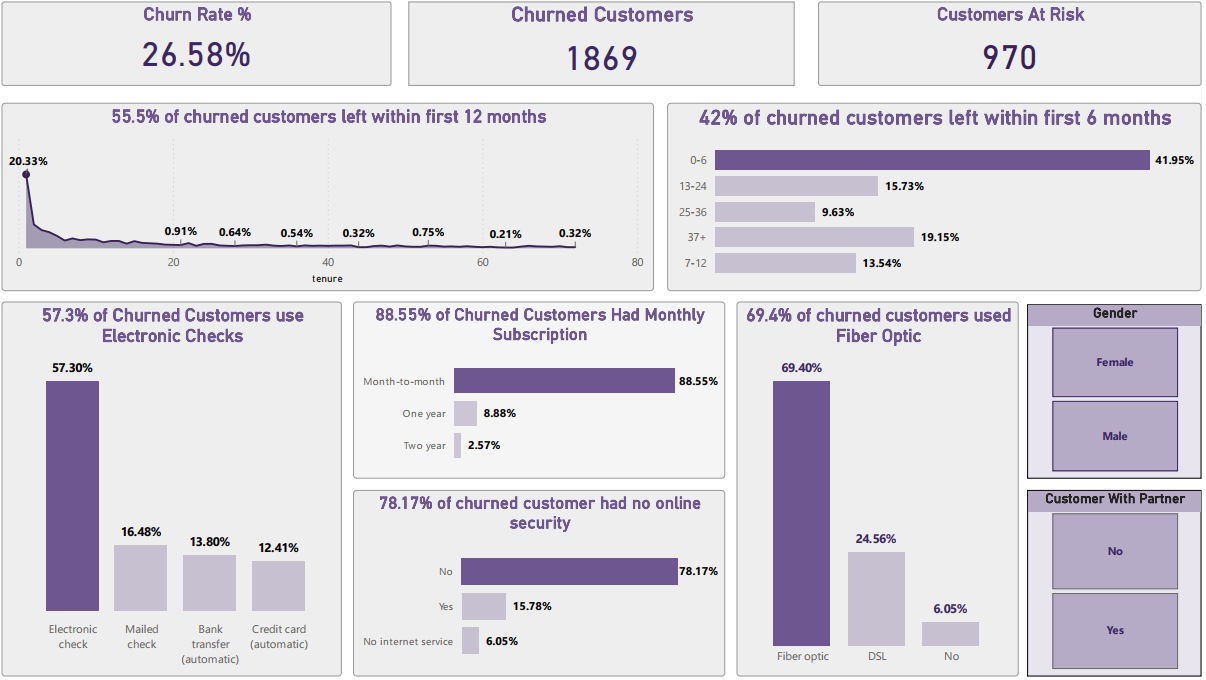
Telco Customer Churn Analysis
📈 Case Study: Telco Customer Churn Analysis
-
Client Type: Mid-size Telecommunications Provider Facing High Customer Attrition
-
Problem: Customer churn costing millions annually, with no clear visibility into who is leaving, why, or when to intervene
- My Approach:
- Analyzed telecom customer dataset using Python (Pandas, Scikit-Learn)
- performed exploratory analysis to identify churn drivers
- built predictive segmentation
- designed an interactive Power BI-style dashboard for retention teams
- Result:
- Discovered month-to-month customers churn at 42.7% vs 2.9% for 2-year contracts
- 55.5% of churn happens in Year 1; security services reduce churn risk by 65%
- electronic check users are 3x more likely to leave → delivered 4 targeted retention strategies
- Tools: Python, Pandas, NumPy, Matplotlib, Seaborn, Scikit-Learn, Power BI (Dashboard)
| **Kaggle Notebook | GitHub** |
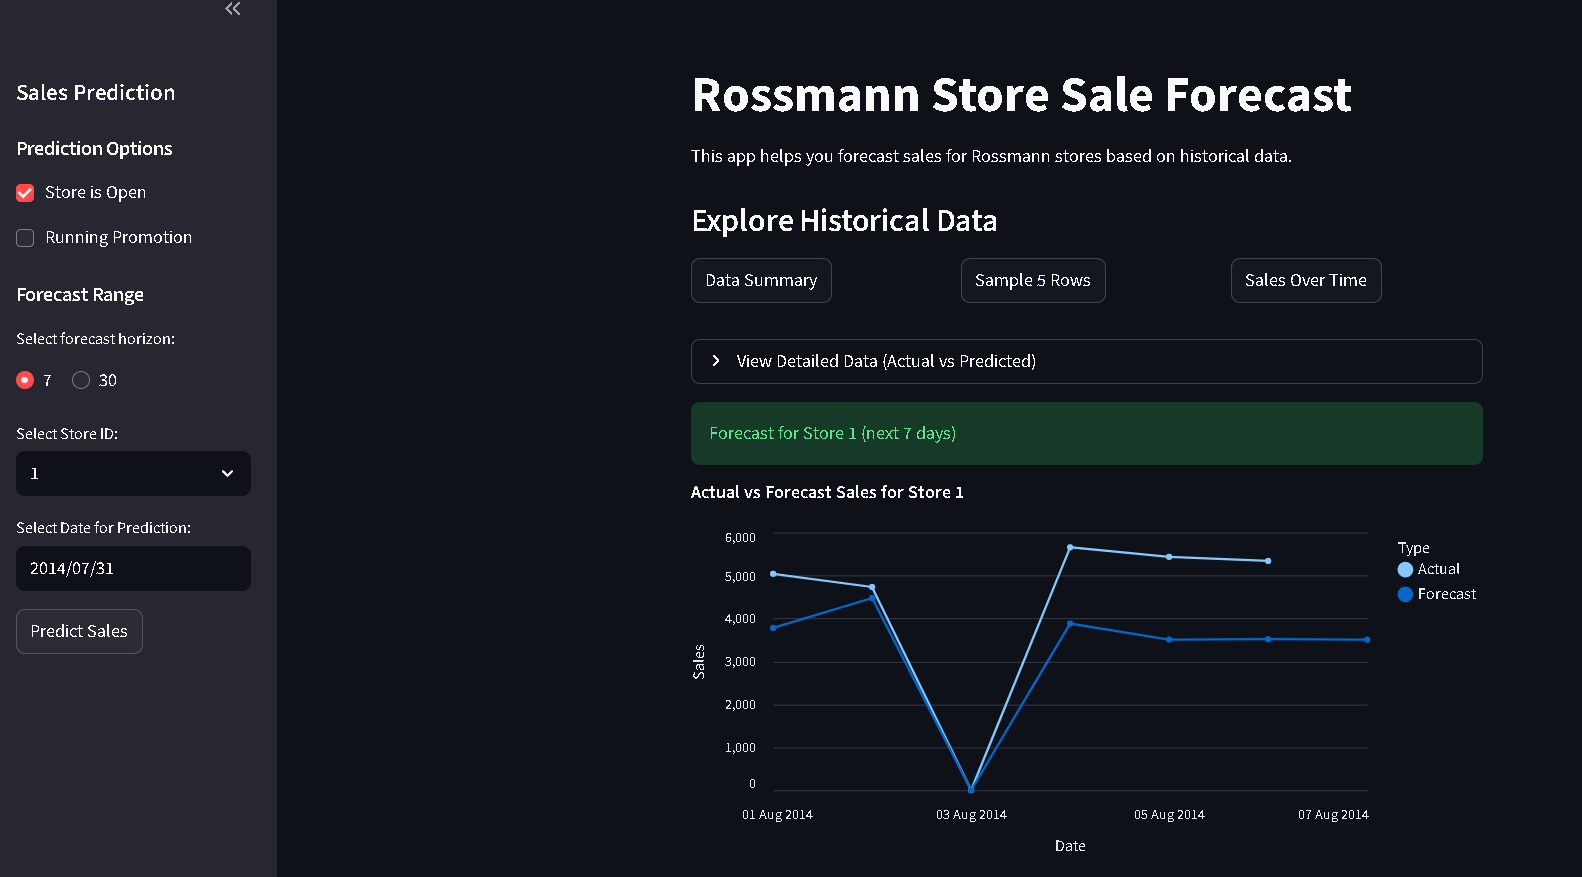
📈 Case Study: Store Sales Forecasting
-
Client Type: Drugstore Retail Chain Operating 1,115 Stores
-
Problem: Inaccurate 6-week sales forecasts led to costly stockouts and overstocking, disrupting inventory operations across 1,115 stores
- My Approach:
- Conducted Time Series EDA to uncover weekly seasonality (Sunday closures) and promotion impact
- engineered features for seasonality and business events
- identified and resolved critical data leakage by removing future ‘Customers’ variable
- trained Random Forest Regressor for production-ready forecasting
- Result:
- Quantified promotions drive ~$3,000/day median sales lift
- achieved R² of 0.85 (MAE $600-800) in production-realistic conditions
- model accurately predicted sales spikes and Sunday closure drops for reliable inventory planning
- Tools: Python, Scikit-Learn, Random Forest, Pandas, Time Series Analysis, Feature Engineering, Streamlit
| **Live Streamlit App | GitHub** |
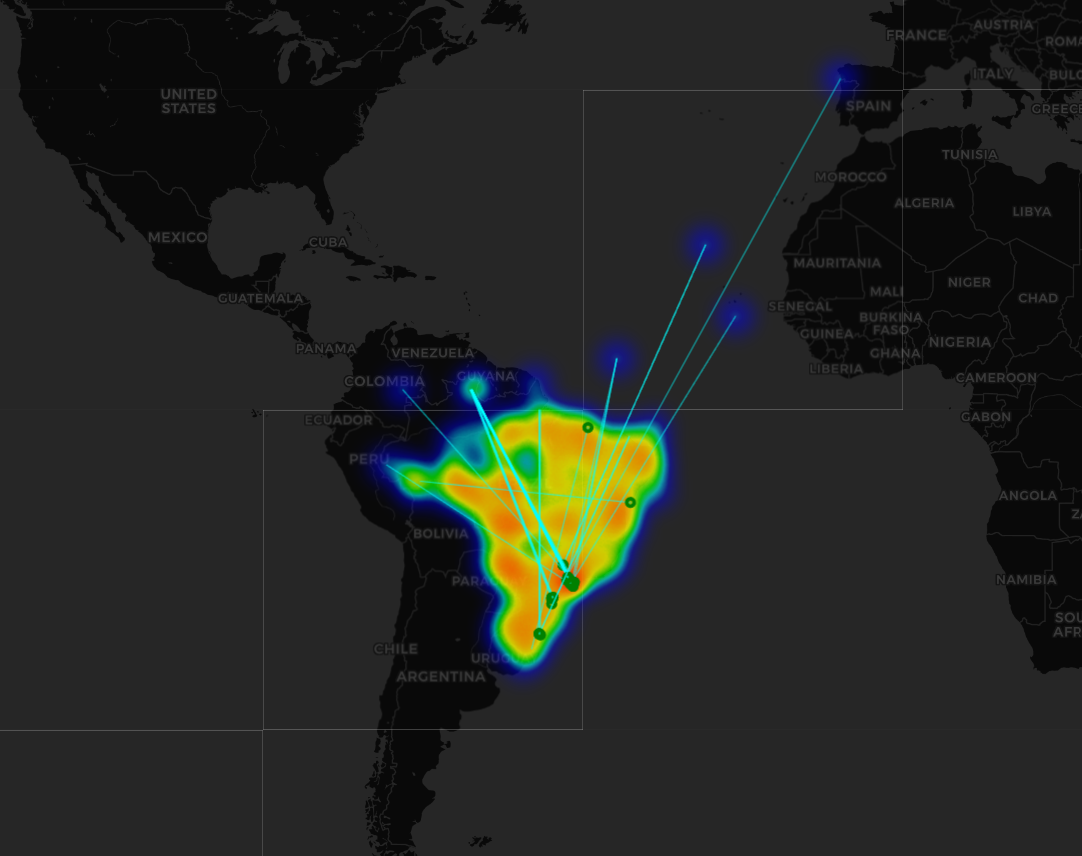
📈 Case Study: E-Commerce Revenue & Logistics Analysis (SQL)
-
Client Type: Brazilian Multi-Category E-Commerce Marketplace with 100K+ Orders
-
Problem: CMO lacked visibility into revenue drivers and high-value customers; Operations team couldn’t pinpoint root causes of 29-day delivery delays in remote Amazon regions; Logistics needed network visualization to validate warehouse placement
- My Approach:
- Built SQLite relational database querying 100K+ orders across 9 tables;
- engineered SQL + Python pipeline joining 5 relational tables to link orders to geocoordinates;
- calculated Haversine Distance via Vectorized NumPy; solved ‘Session vs. User’ identity using customer_unique_id for LTV;
- applied CTEs + Window Functions (LAG) for retention analysis
- Result:
- Identified Health & Beauty as top category with exponential growth ($134→$119K/month)
- pinpointed Northern Region bottleneck (29-day avg delivery in RR/AP/AM)
- generated VIP list (Top Whale: R$13.4K) for loyalty program; visualized ‘Last Mile’ density confirming need for São Paulo distribution hubs
- flagged international shipping anomalies for data governance review
- Tools: SQL (SQLite), Python (Pandas, NumPy, Folium), Geospatial Analysis (Haversine), Window Functions, CTEs
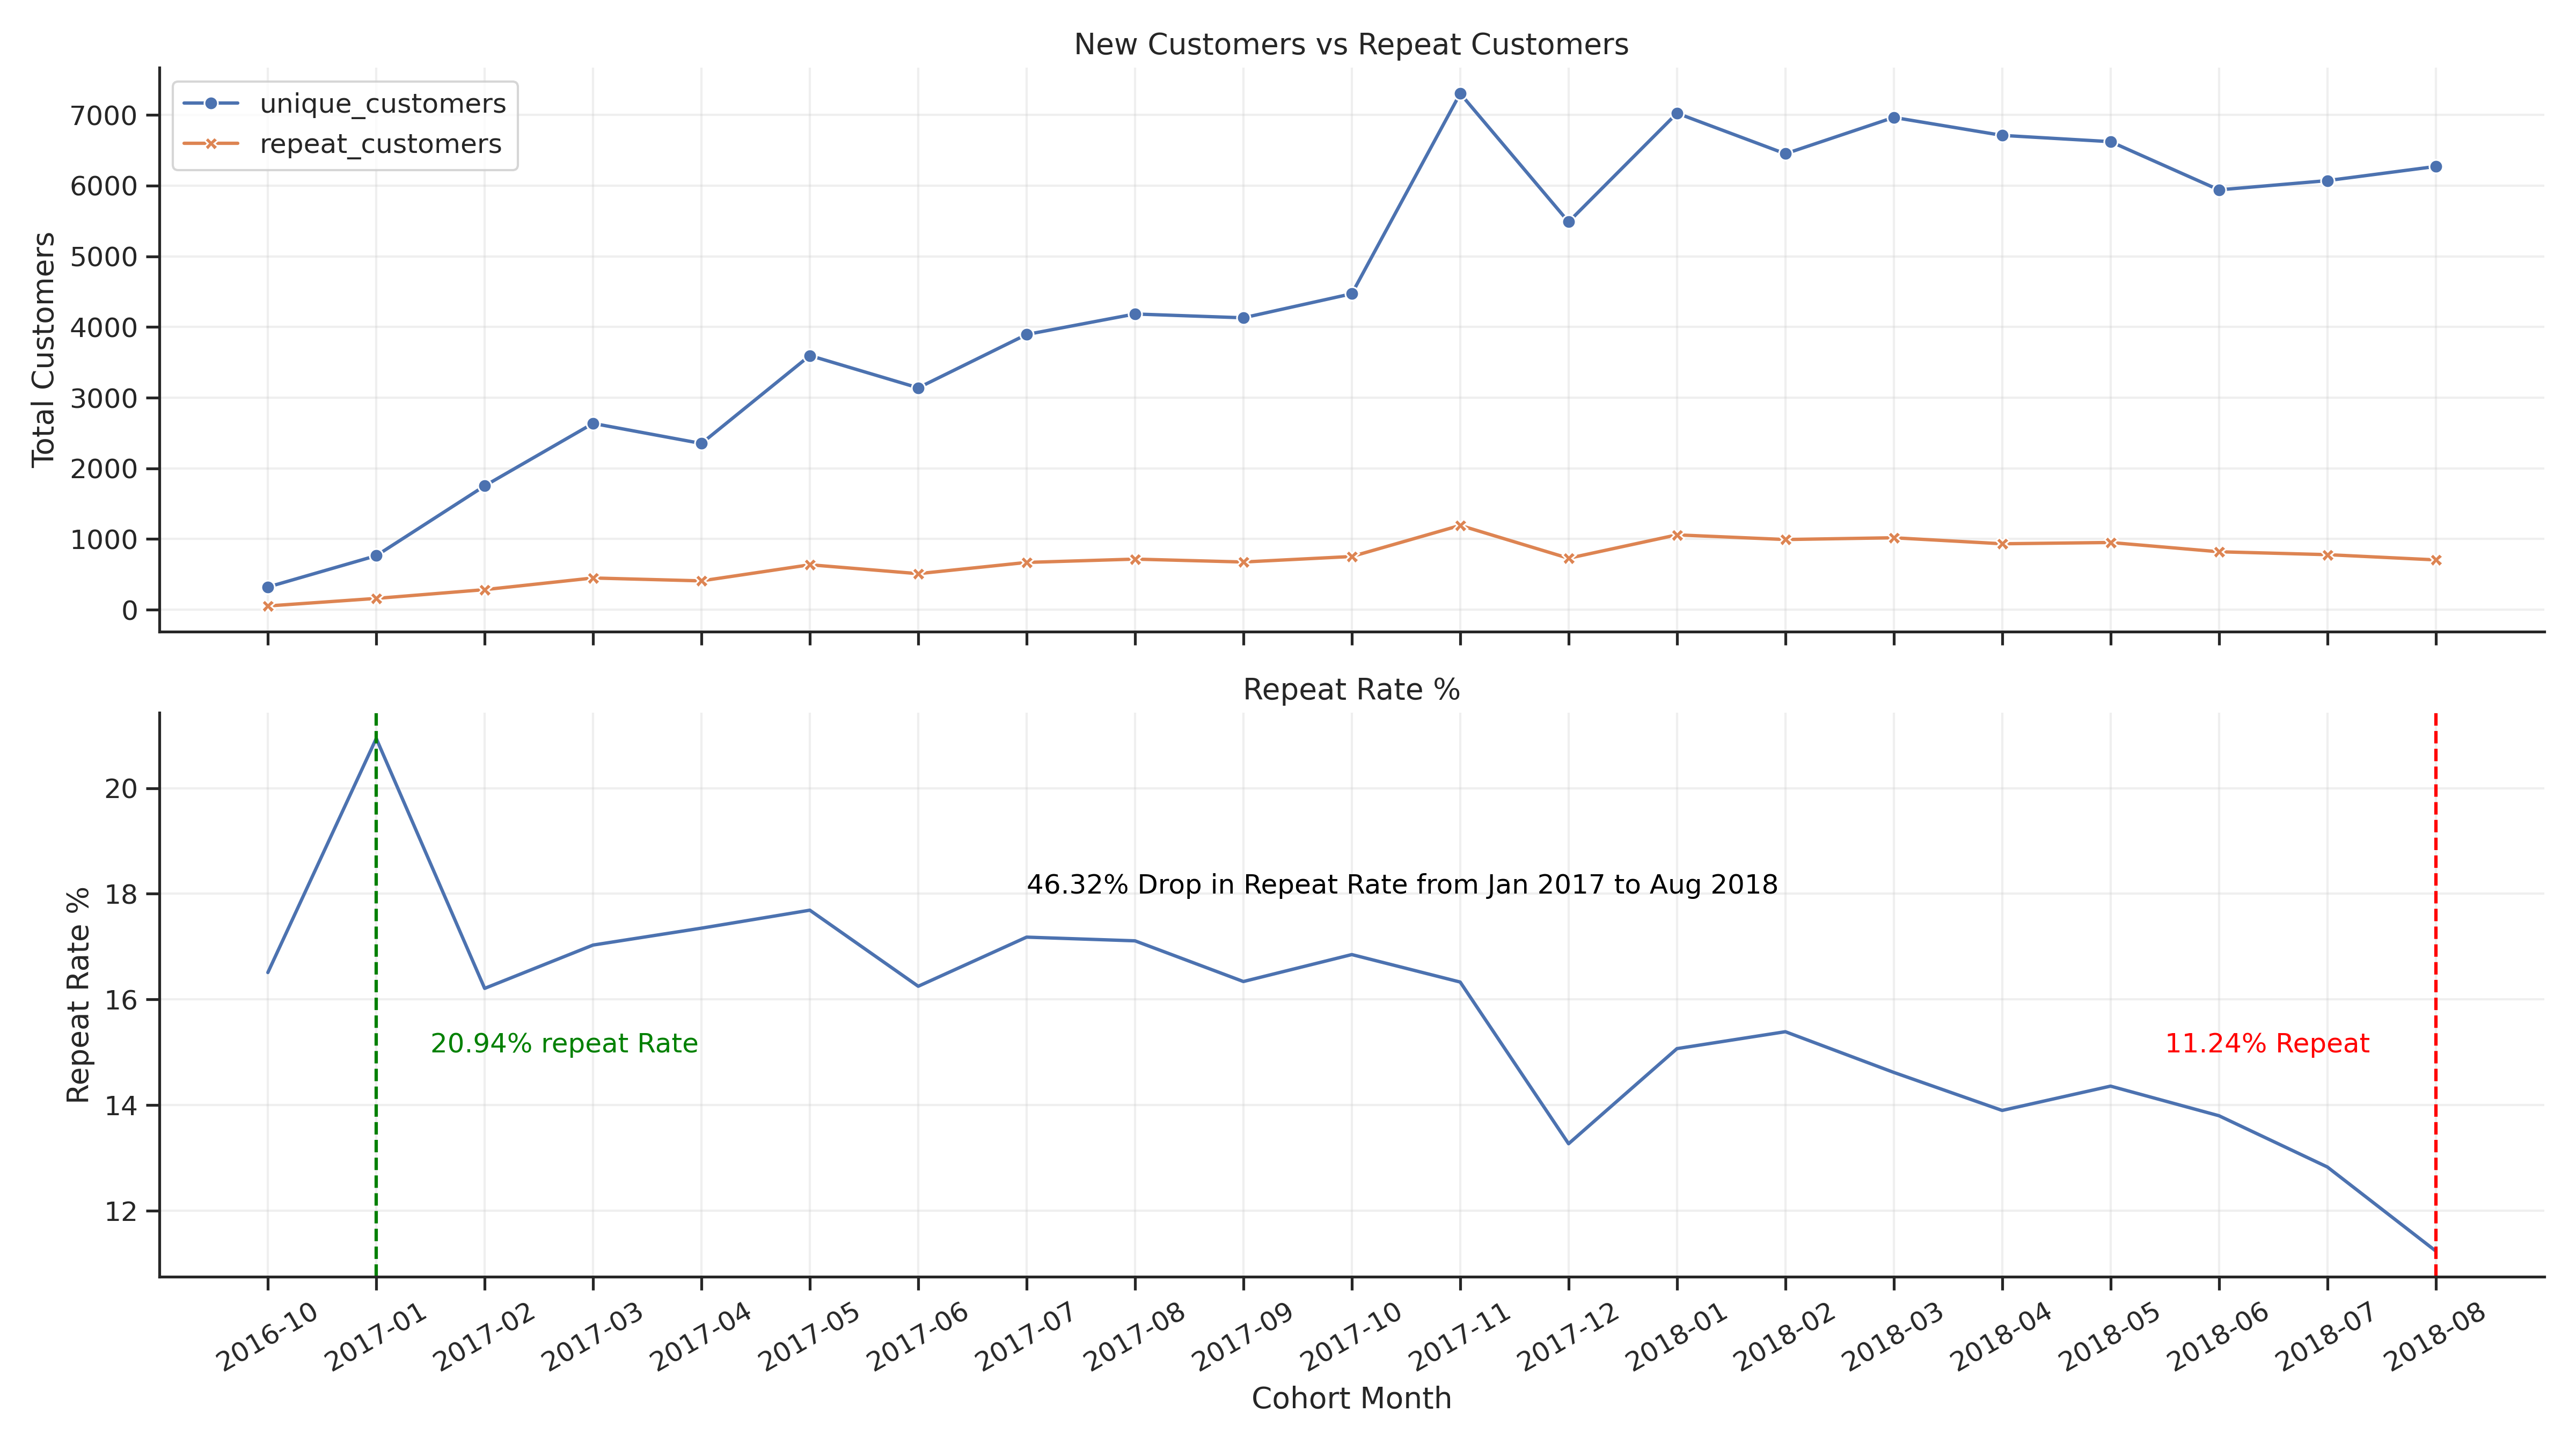
📈 Case Study: Olist E-Commerce Retention Analysis
-
Client Type: Brazilian Multi-Category E-Commerce Marketplace (Olist) with 100K+ Orders
-
Problem: 96.9% of customers never make a second order; no visibility into why customers don’t return or where the biggest revenue opportunities lie for improving retention
- My Approach:
- Analyzed 100K+ completed orders using Python (Pandas, SciPy)
- filtered for delivered orders, excluded incomplete cohorts (<60 days)
- applied statistical validation (linear regression) to identify retention trends
- modeled revenue impact of improving repeat purchase rates
- Result:
- Quantified 3.12% repeat purchase rate; identified +312K BRL (~$62K) monthly revenue opportunity if rate improves to 5%
- discovered Home Essentials retain 2.5x better than Toys/Gifts (26% vs 10%)
- detected statistically significant -0.28%/month retention decline (p<0.001)
- Delivered 3 prioritized, ROI-backed retention strategies
- Tools: Python, Pandas, NumPy, Matplotlib, Seaborn, SciPy (linregress), Statistical Modeling
| GitHub Repository | Notebook |
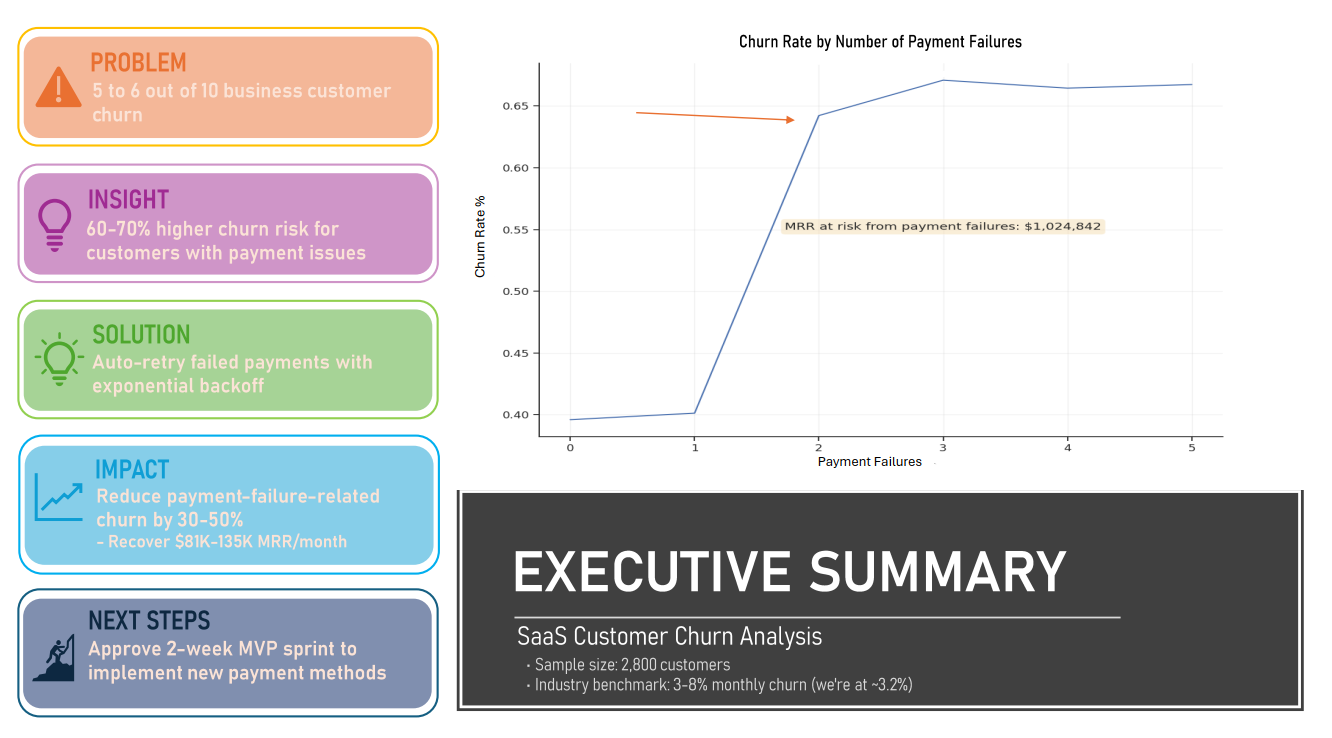
📈 Case Study: SaaS Customer Churn & Payment Friction Analysis
Client Type: B2B SaaS Company with Subscription Revenue Model (2,800 Customer Records)
- Problem:
- 57.3% overall churn rate (~3.2% monthly) with $1M+ MRR at risk
- no clarity on whether churn was driven by plan type, product fit, or operational friction like payment failures
- My Approach:
- Analyzed 2,800 customer records using Python (Pandas, SciPy)
- applied chi-square testing to validate plan-level churn differences
- modeled revenue impact of payment failure interventions
- prioritized recommendations using statistical significance + business impact + effect size framework
- Result:
- Identified payment failures (2+) as primary churn driver (60-70% higher risk), NOT plan type (p=0.63)
- Quantified $270K salvageable MRR from at-risk active customers
- Projected $81K-135K/month recoverable revenue with 30-50% churn reduction
- Delivered 3 prioritized, ROI-backed retention plays with <1-month payback
- Tools: Python, Pandas, NumPy, Matplotlib, Seaborn, SciPy (Chi-Square, Statistical Modeling), Revenue Forecasting
📄 Certifications
- IBM Professional Data Analyst
- Google Advanced Data Analysis
- Bachelor of Science
This portfolio is continuously updated with new projects and improvements.