🛒 Olist E-Commerce Retention Analysis
Analyzing 100K+ orders to uncover drivers of customer retention and quantify revenue opportunities
![]()
![]()
![]()
🎯 Business Question
What drives customer retention in a Brazilian e-commerce marketplace, and where are the biggest revenue opportunities to improve repeat purchases?
💰 Key Findings (Executive Summary)
| Metric | Value | Business Impact |
|---|---|---|
| Overall repeat purchase rate | 3.12% | 96.9% of customers never make a 2nd order |
| Revenue opportunity | +312K BRL (~$62K USD) | If repeat rate improves from 3.12% → 5% |
| Best-retaining category | Home Essentials (26%) | 2.5x higher than Toys/Gifts (10%) |
| Retention trend | -0.28%/month | Statistically significant decline (p<0.001, R²=0.70) |
| Average Order Value (AOV) | 172.73 BRL | Basis for revenue modeling |
📊 Visualizations
Customer Retention Funnel
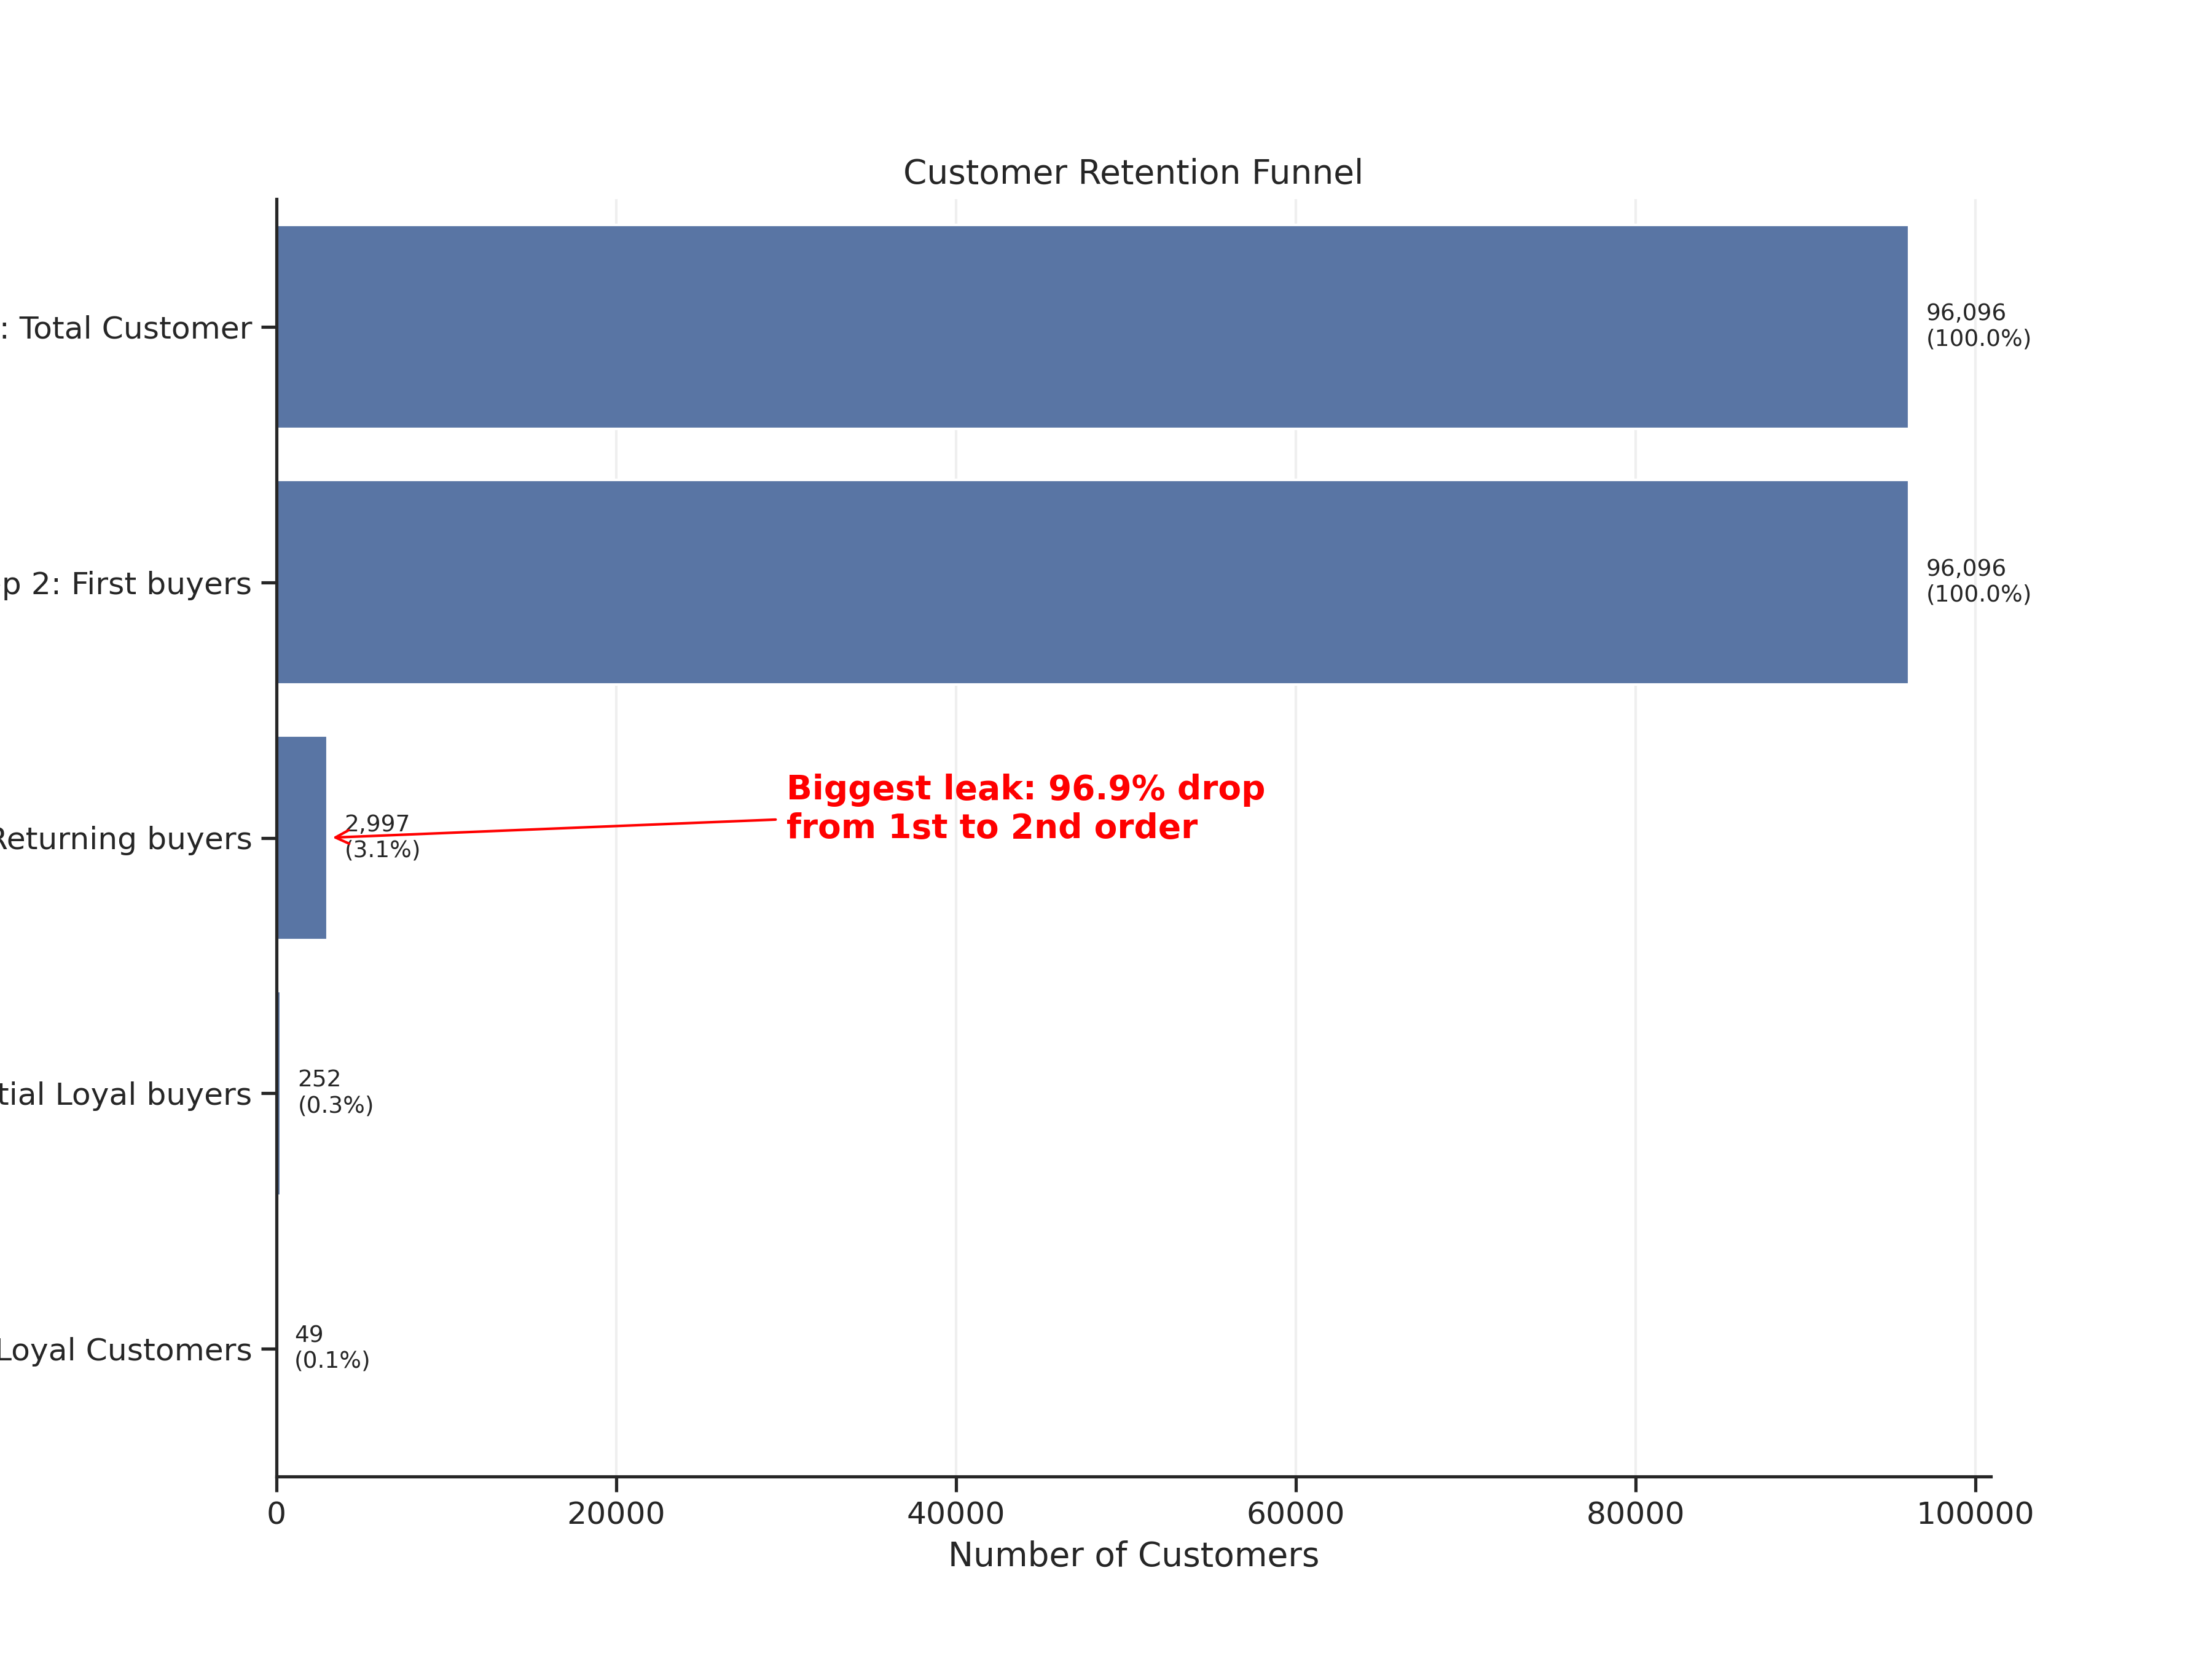 96K customers → 3K repeat buyers. Biggest leak: Step 3 (first → second order).
Revenue Impact Model
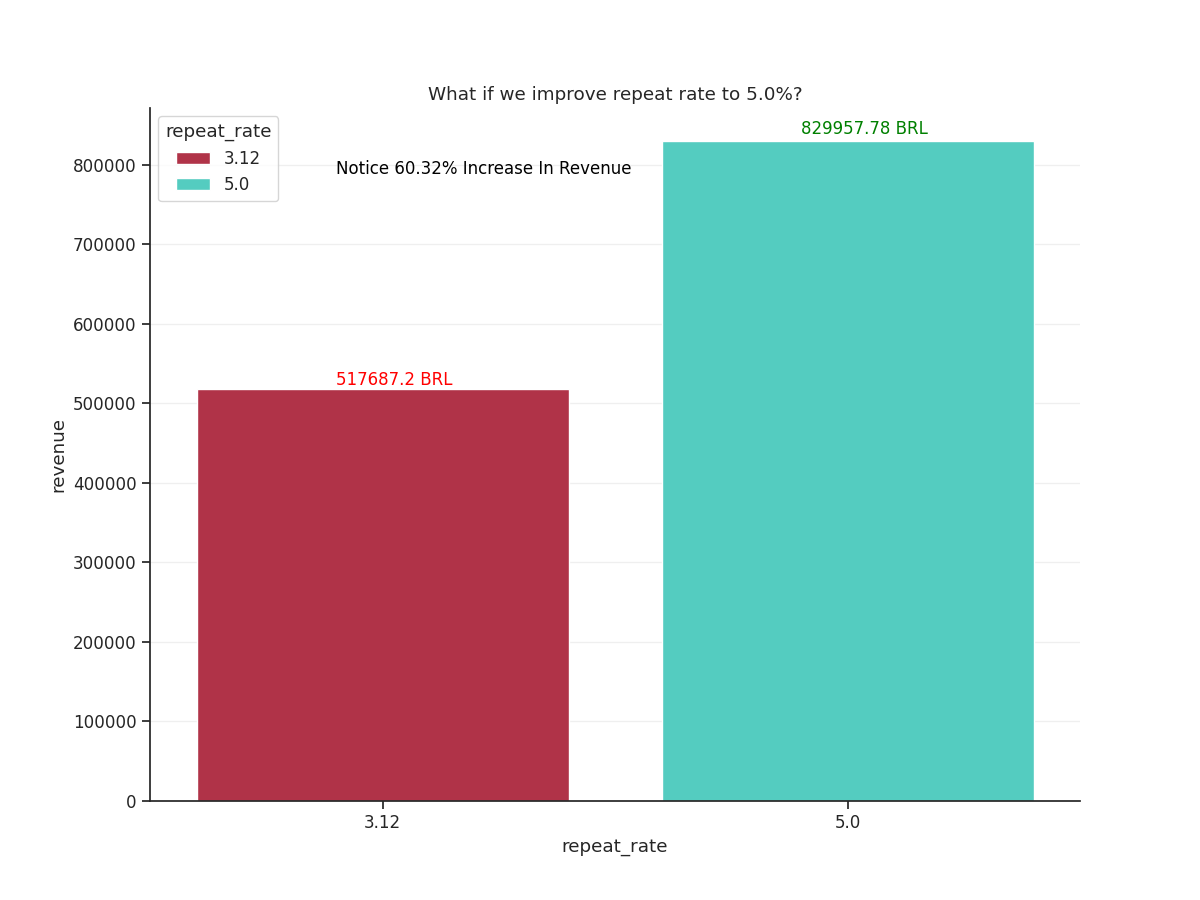 Improving repeat rate to 5% = +312K BRL/month revenue opportunity.
Prerequisites
- Python 3.8+
- Required packages:
pandas,matplotlib,seaborn,scipy
Data Processing
- Filtered to completed orders only (
order_status == 'delivered') - Excluded cohorts <60 days old to avoid incomplete repeat behavior
- Filtered categories/cities with <500 customers to reduce noise
Statistical Validation
- Trend significance tested via linear regression (
scipy.stats.linregress) - Repeat rate = customers with ≥2 orders / total customers
- AOV calculated from
payment_valuecolumn: 172.73 BRL
Limitations
- Observational data: Correlation ≠ causation. Findings require A/B testing for validation.
- Time window: Dataset ends Aug 2018; newer customer behavior not captured.
- Geographic granularity: City-level analysis may mask neighborhood patterns.
- Missing features: No customer demographics or marketing touchpoint data.
💡 Key Recommendations
- Prioritize home essentials categories for retention campaigns (2.5x higher repeat rate)
- Launch a 2nd-order incentive for first-time buyers of non-essential categories
- Investigate retention decline via customer surveys targeting 2018 cohorts
- Monitor cohort repeat rates monthly as a leading indicator of business health
Full recommendations with owners + timelines in insights.md
👤 Author Ahmed Elatwy.
📧 ahmed.abbas.elatwy@gmail.com
| 🇪🇬 Based in Egypt | Open to freelance + full-time analytics roles |