London-Bike-Sharing-Analysis
1. The Goal
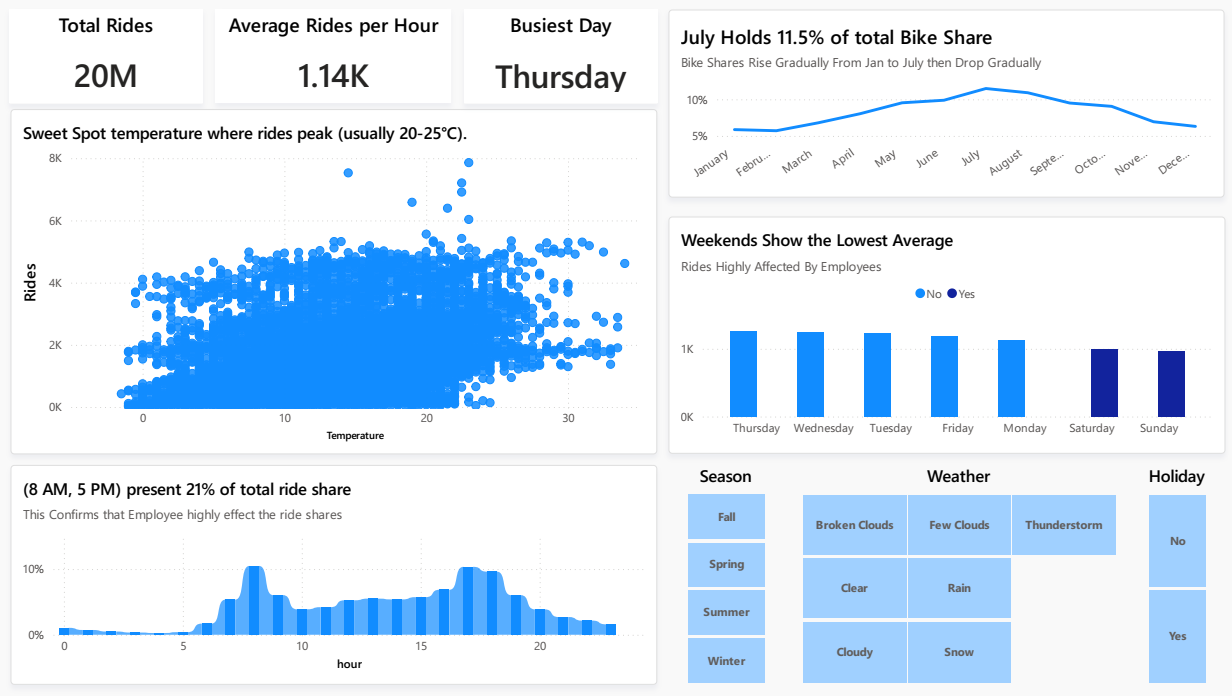
• The objective of this project was to predict bike-sharing demand in London to optimize fleet logistics. Using historical data from 2015-2017, we analyzed the impact of weather and time on ridership.
2. Key Findings
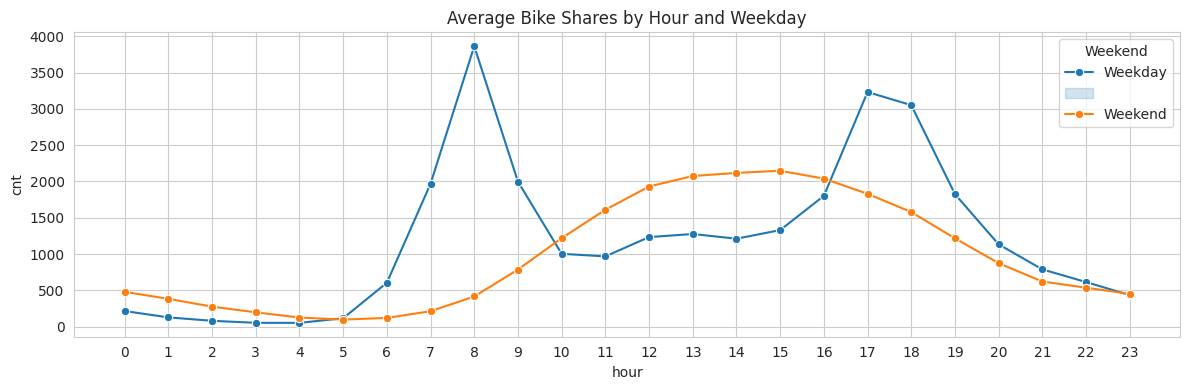
• The Commuter Heartbeat: The system is powered by workers. Distinct peaks at 8:00 AM and 5:00 PM confirm this is a transit utility, not just a tourist attraction.
• The Weather Sensitivity:
o Temperature is the strongest driver of volume. Ridership increases linearly as temperature rises.
o Rain causes a ~39% drop in demand, but 61% of users continue to ride, proving high service stickiness.
o Seasonality: Demand hits rock bottom in December/January, making this the ideal window for heavy fleet maintenance.
3. The Solution
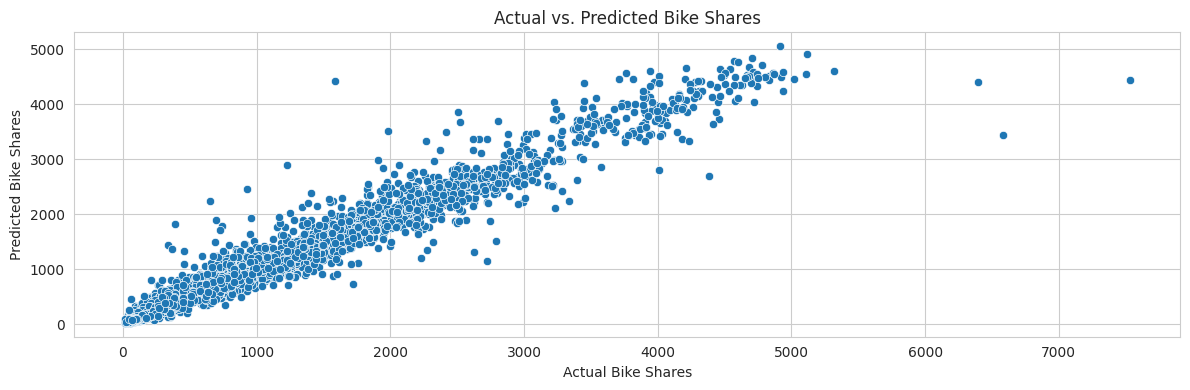
• Algorithm: Random Forest Regressor.
• Performance: Achieved an R2 Score of 0.95, capturing 95% of the variance in demand.
• Reliability: The model successfully differentiates between high-demand scenarios (4,000+ bikes) and low-demand scenarios (less than 50 bikes) with high precision.
4. Recommendations for Operations
• Dynamic Trucking: Use the predict_demand() tool to pre-stock stations at 7:00 AM on days forecasted to be above 20°C.
• Maintenance Scheduling: Shift major repair work to January, where demand is ~50% lower than July.
• Staffing: Reduce staffing during “Heavy Rain” forecasts, as demand reliably drops by nearly 40%.