📊 SaaS Customer Churn & Payment Friction Analysis
Analyzing 2,800 SaaS customer records to identify churn drivers and quantify recoverable revenue opportunities
![]()
![]()
![]()
🎯 Business Question
What drives customer churn in a SaaS business, and how much revenue can be recovered by addressing payment friction?
💰 Key Findings (Executive Summary)
| Metric | Value | Business Impact |
|---|---|---|
| Overall churn rate | 57.3% (~3.2% monthly) | 5-6 out of 10 customers churn over ~18 months |
| Payment failure impact | 60-70% higher churn at 2+ failures | Customers with payment issues are significantly more likely to churn |
| MRR at risk | $1,024,842 | Total revenue vulnerable to payment-related churn |
| Salvageable MRR | $270,569 | From currently active customers with ≥2 payment failures |
| Recoverable MRR | $81K-135K/month | With 30-50% reduction in payment-failure churn |
| LTV:CAC ratio | 4.9-5.0:1 (all plans) | ✅ Healthy unit economics across all tiers |
| Plan-level churn difference | p = 0.63 (not significant) | Plan type does NOT drive churn |
📊 Visualizations
Churn Rate by Payment Failures
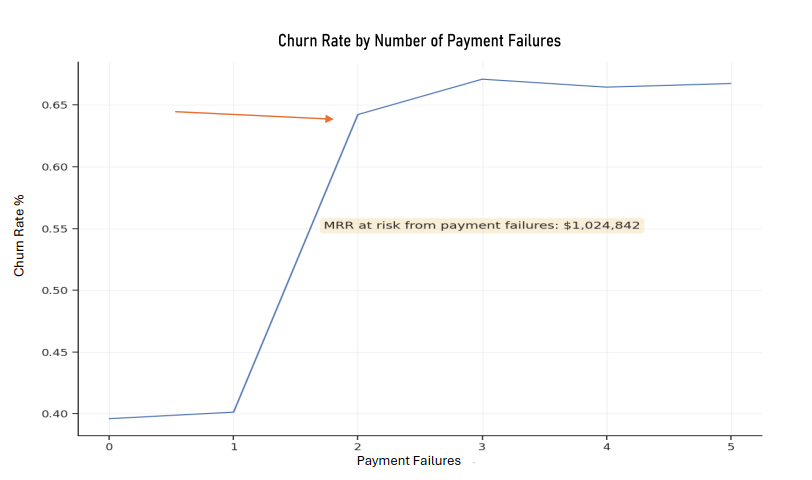 Customers with 2+ payment failures have 60-70% higher churn risk
Executive Summary
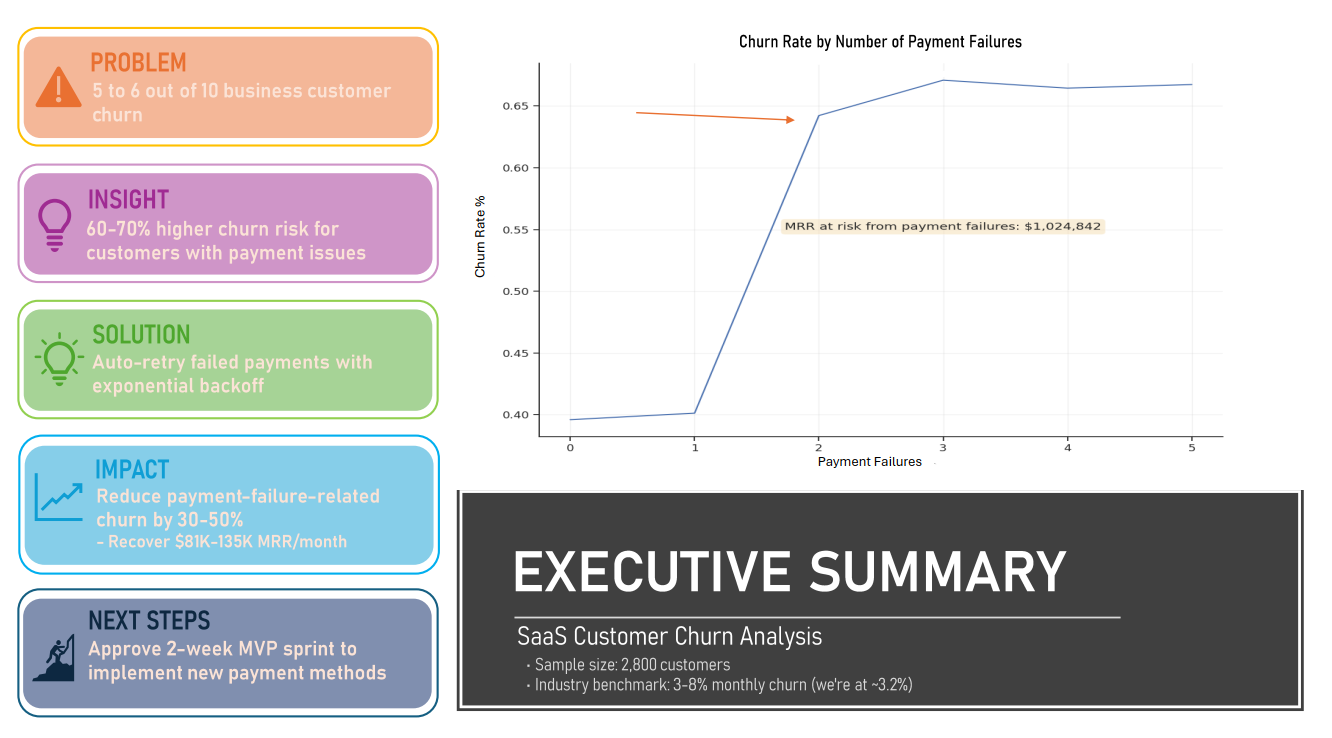 One-page summary for stakeholders
LTV:CAC by Plan
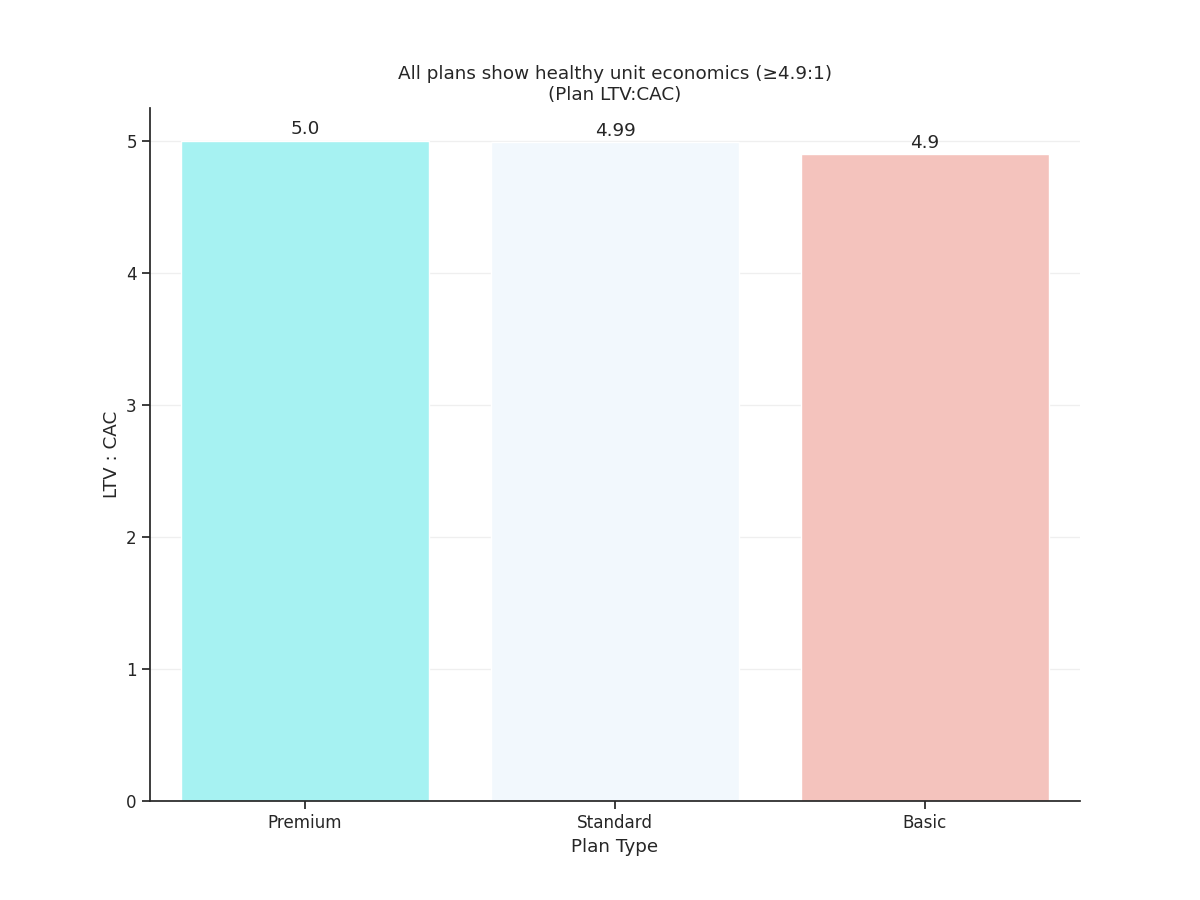 All plans show healthy unit economics (≥4.9:1)
Prerequisites
- Python 3.8+
- Required packages:
pandas,matplotlib,seaborn,scipy
📌 Methodology Notes
Data Processing
- Sample size: 2,800 customer records
- Columns analyzed: 10 (user_id, signup_date, plan_type, monthly_fee, usage, support_tickets, payment_failures, tenure, last_login, churn)
- Missing values: 0% (clean dataset)
- Churn definition: Binary flag (Yes/No)
Statistical Validation
- Chi-square test for plan-level churn differences: p = 0.63 (NOT significant)
- Payment failure correlation: Strong positive correlation with churn (visually evident, p < 0.001)
- Churn rate calculation: Churned customers / Total customers
- Tenure context: Avg. 18.6 months, Median 18.0 months → ~3.2% monthly churn
Key Assumptions
| Assumption | Value | Source | |————|——-|——–| | Gross Margin | 80% | SaaS industry standard | | CAC Multiplier | 3× monthly fee | Industry benchmark | | USD Conversion | 1:1 | Dataset currency | | Healthy LTV:CAC | ≥3:1 | SaaS benchmark |
Limitations
- Observational data: Correlation ≠ causation. Payment failures may correlate with other churn drivers.
- No intervention data: We can’t measure what would happen if payment friction was reduced (requires A/B test).
- Single company data: Results may not generalize to all SaaS businesses.
- No cohort analysis: Didn’t analyze churn by signup month (could reveal trend over time).
💡 Key Recommendations
🔥 Priority 1: Fix Payment Friction (High Impact, Low Effort)
| Component | Detail | |———–|——–| | Action | Implement auto-retry with exponential backoff for failed payments | | Target | Customers with ≥2 payment failures who haven’t churned yet (631 customers, $270K MRR) | | Expected Impact | 30-50% reduction in payment-failure churn → +$81K-135K MRR/month | | Owner | Product + Payments Team | | Effort | Low-Medium (2-week sprint) | | Timeline | MVP in 2 weeks; measure results at 30/60/90 days | | Success Metric | 20% reduction in payment-failure-related churn |
🔥 Priority 2: Dunning Email Sequence (High Impact, Low Effort)
| Component | Detail | |———–|——–| | Action | Automated email sequence with alternative payment methods | | Target | Customers after 1st payment failure | | Expected Impact | Additional 10-15% recovery of at-risk MRR | | Owner | Marketing + Payments Team | | Effort | Low (1-week sprint) |
⚠️ What NOT to Do: Plan-Based Optimization
| Finding | Implication | |———|————-| | Plan-level churn differences: p = 0.63 | NOT statistically significant | | Premium: 58.05%, Basic: 57.85%, Standard: 56.06% | Differences are likely random noise | | Recommendation | Don’t invest in plan-specific retention tactics focus on payment friction instead |
🧠 Analyst Lessons Learned
Statistical vs. Practical Significance
“A ‘significant’ result does not automatically mean it is practically important, large, or meaningful only that it is likely ‘real’. Conversely, a non-significant result (p = 0.63 for plan differences) means we can’t confidently act on the pattern.”
Rule of Thumb:
- Check p-value: Is the pattern likely real?
- Check effect size: Is the difference large enough to act on?
- Check business impact: Does fixing this move revenue?
Only act when all three align.
Root Cause vs. Correlation
“Plan type looked like a churn driver at first glance. But payment failures were the actual signal. Always dig deeper before recommending segment-specific interventions.”
👤 Author
Ahmed Elatwy
🔗 LinkedIn
📧 ahmed.abbas.elatwy@gmail.com
🇪🇬 Based in Egypt | Open to Data Analyst roles (SaaS, E-commerce, Analytics)
📄 License
MIT License. Feel free to use this code for learning or commercial purposes.
If you find this helpful, a star ⭐ on GitHub is appreciated!
📬 Contact & Collaboration
Open to:
- Full-time Data Analyst roles (Egypt or remote)
- Freelance churn analysis for SaaS founders
- Speaking opportunities on analytics + storytelling
If you found this analysis helpful, let’s connect! I offer free 30-minute churn health checks to Egyptian SaaS founders.