E-Commerce-Revenue-Logistics-Analysis-SQL

Domain:
E-Commerce / Operations
Business Problem:
The CMO of a Brazilian marketplace needed to identify revenue drivers and high-value customers, while the Operations Director required a root-cause analysis of delivery delays in remote regions, The Logistics Director needed to visualize the distribution network to identify long-distance shipping inefficiencies and validate warehouse locations.
My Approach:
-
Built a local relational database using SQLite to query over 100k orders across 9 connected tables.
-
Executed complex Multi-Table Joins to link Products, Orders, and Customers, enabling a granular revenue analysis.
-
Engineered a SQL + Python Pipeline to join 5 relational tables (Orders, Items, Customers, Sellers, Geolocation), linking 100k+ orders to their physical coordinates.
-
Calculated the Haversine Distance (Great Circle) between every Buyer and Seller using Vectorized NumPy functions.
-
Solved the “Session vs. User” identity challenge by aggregating on customer_unique_id to calculate Customer Lifetime Value (LTV).
Key Results:
-
Identified Health & Beauty as the top category, revealing an exponential growth trend (from $134 to $119k/month).
-
Pinpointed a critical logistics bottleneck in the Northern Region (Amazon Basin), where average delivery times hit ~29 days (States: RR, AP, AM).
-
Generated a verified “VIP List” of top spenders (Top Whale: R$ 13.4k) for the loyalty program.
-
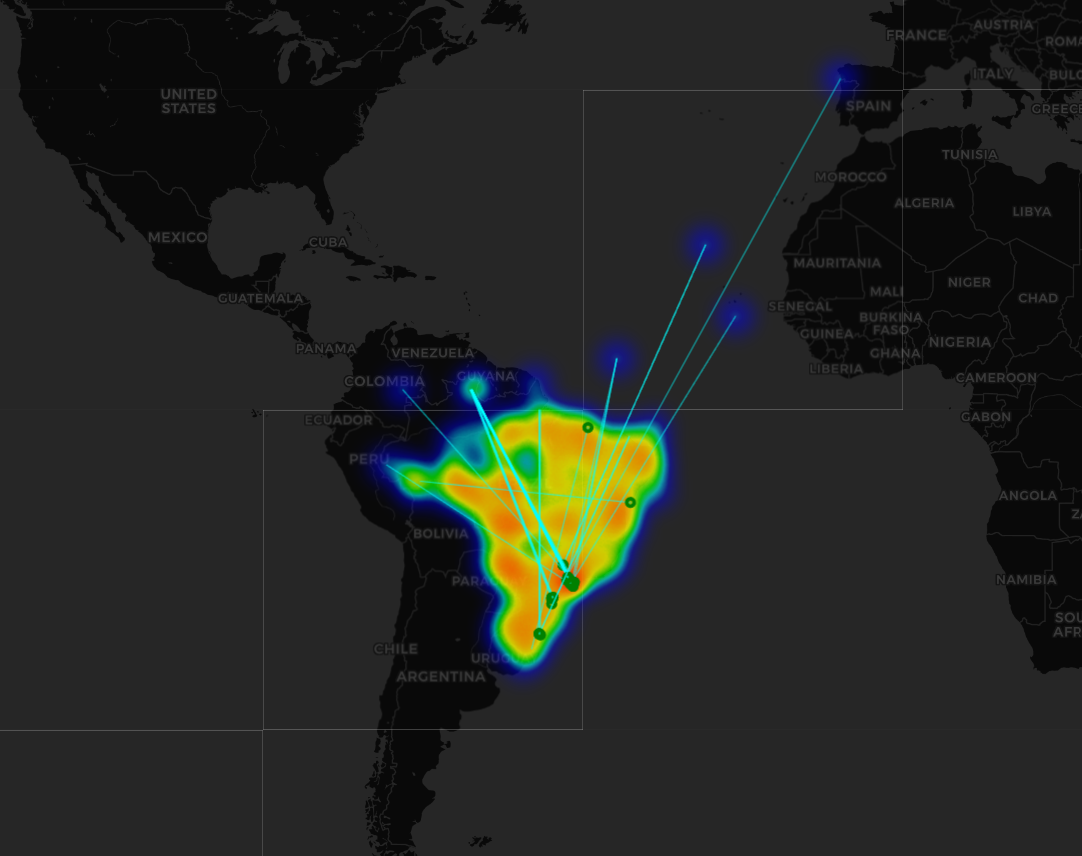
Identified data anomalies (potential international shipping errors to Europe) requiring data governance review.
-
Visualized the “Last Mile” density, confirming the need for localized distribution hubs in the São Paulo region to reduce shipping costs.
Customer Retention Analysis (Advanced SQL):
-
Utilized Common Table Expressions (CTEs) and Window Functions (LAG) to calculate the time-lapse between customer orders.
-
Identified repeat purchasing patterns to inform “Win-Back” marketing strategies.
Tech Stack:
SQL (SQLite), Python (Folium, NumPy, Pandas).
Built an interactive Folium Heatmap to visualize demand density and plotted “Long-Haul” delivery routes to identify extreme outliers.